A full spreadsheet: formula calculations, named ranges, inline charts, and data validation rules that catch bad entries before they land.
What this demo shows in Hollow Workbooks
Explore a project plan in a spreadsheet.
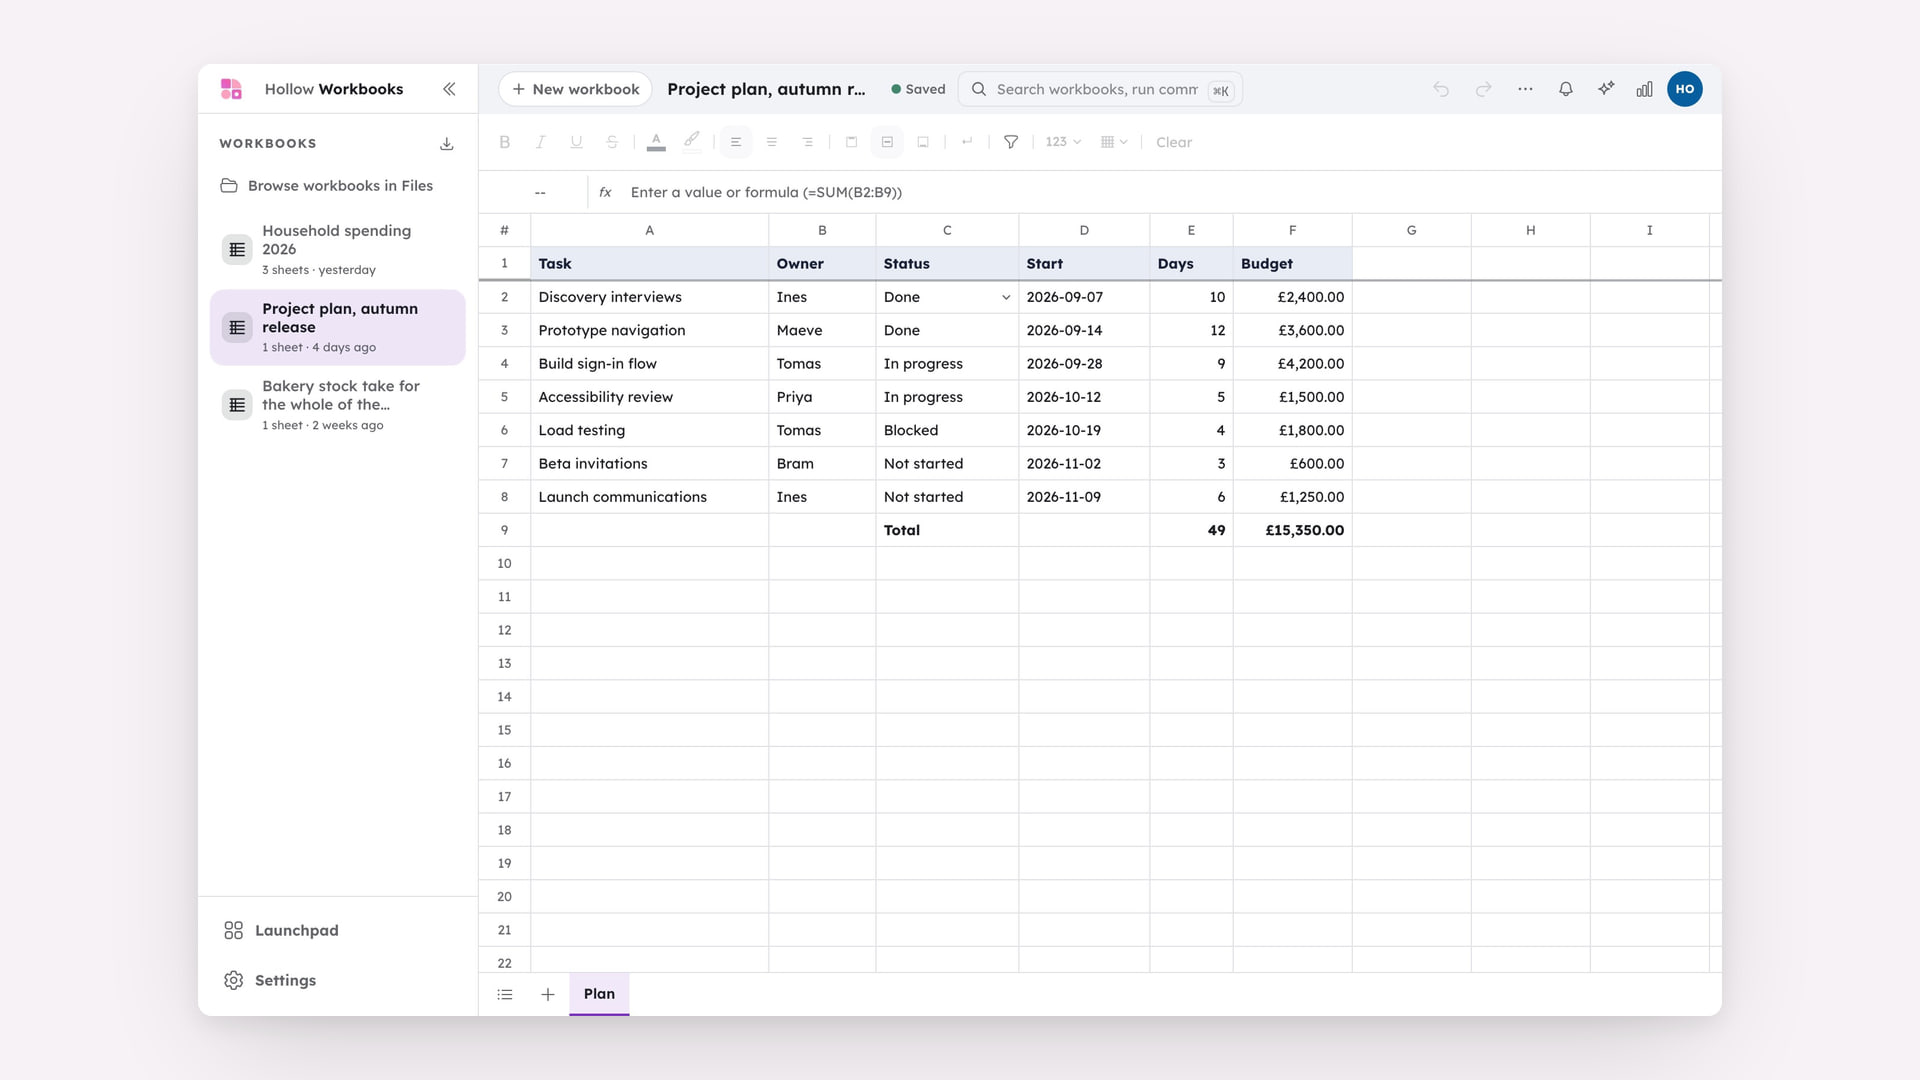
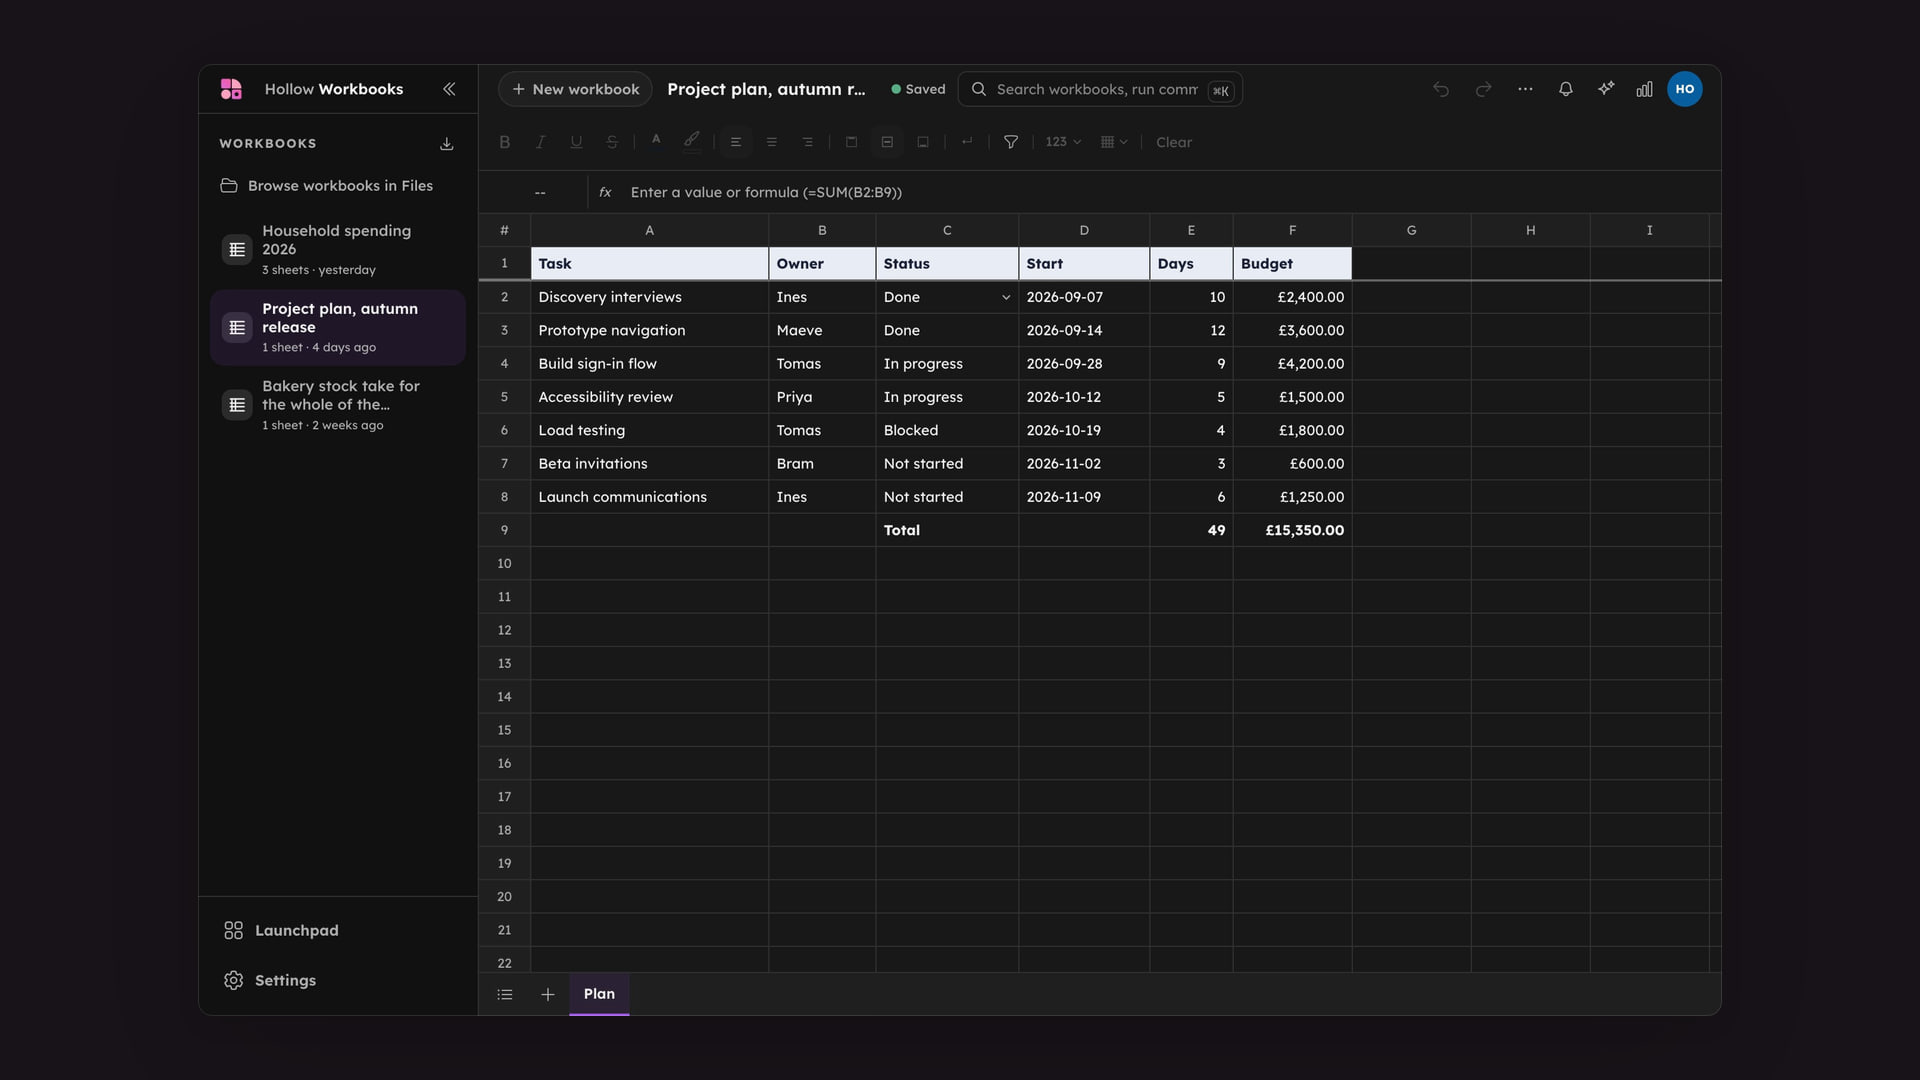
A workbook shows a grid of example project information.
Selecting a cell brings it into focus.
Hollow Workbooks demo
The formula bar supports address referencing (`A1:C10`) and autocomplete, with a function library that includes SUM, AVERAGE, COUNT, MIN, MAX, IF, SUMIF, VLOOKUP, XLOOKUP, CONCATENATE and many more. Name your own ranges (`Sales_2026`) from the Named Ranges dialog. Highlight a range of numbers and the status bar shows their sum, average and count, without writing a formula.
Build a chart straight from a range, Bar, Line, or Pie, and it renders right there on the grid.
Set conditional formatting by value threshold or range (greater than, less than, equal, between and so on), format numbers as currency, percent, date, or plain number, style cell borders, and add data validation drop-down lists to keep entries consistent.
Each workbook can hold as many sheets as it needs: add, rename, reorder and delete the tabs. Import XLSX, CSV, TSV and ODS files. Export the whole workbook as XLSX, or the active sheet as CSV.
If the workbook was changed in another tab or on another device, a conflict indicator in the topbar lets you review it, so nobody’s change is silently overwritten.